 APXS concentration data
mission specific
Chemical concentration results derived from archived data by the MSL APXS team have been added to the Notebook. These results are not archived products themselves but are included in the Notebook as supplementary material. Each composition is associated with a target.
APXS concentrations
The Alpha Particle X-ray Spectrometer (APXS) determines the bulk chemistry of targets on Mars through the complementary use of particle-induced X-ray emission and X-ray fluorescence. The spectrum obtained from the interrogation of a target is analyzed using a calibration and empirical peak-fitting routine adapted from the predecessor Mars Exploration Rover APXS method (Gellert, R., Rieder, R., et al, Alpha Particle X-Ray Spectrometer (APXS): Results from Gusev crater and calibration report, J. Geophys. Res., 111, E02S05, doi:10.1029/2005JE002555 ).
When placed in contact with a target, the APXS results represent the composition from a circular field of view 15 mm in diameter. This field of view increases with separation between the APXS and its intended target. The center of Mars Hand Lens Imager (MAHLI) images of APXS targets are not always aligned with the center of the APXS field of view, even when commanded to the same spot. Users interpreting APXS data along with the associated target image(s) should exercise caution when inferring the footprint of an APXS measurement. APXS placement has been observed to vary by up to (and possibly exceeding) 50% of the width of the APXS field of view compared to the planned target location or center of the MAHLI image (e.g., see VanBommel et al., 2016, doi:10.1002/xrs.2681 ).
Data quality
The MSL APXS team provides concentration data acquired during surface operations. Some measurements are considered to be of lesser quality as a result of increased uncertainty in the derived composition. Measurements under one hour in duration, with a large separation (>2 cm) between the APXS and the target, or with warm temperatures (resulting in a FWHM at 6.4 keV of >175 eV) are not included in the Notebook but are available from the PDS Geosciences Node MSL APXS RDR extras data holdings.
Interactive data viewer
All APXS concentration data in the Notebook can be accessed from the  Resources tab by clicking on the APXS concentration data link. A window will open with an empty chart and a list of APXS targets underneath.
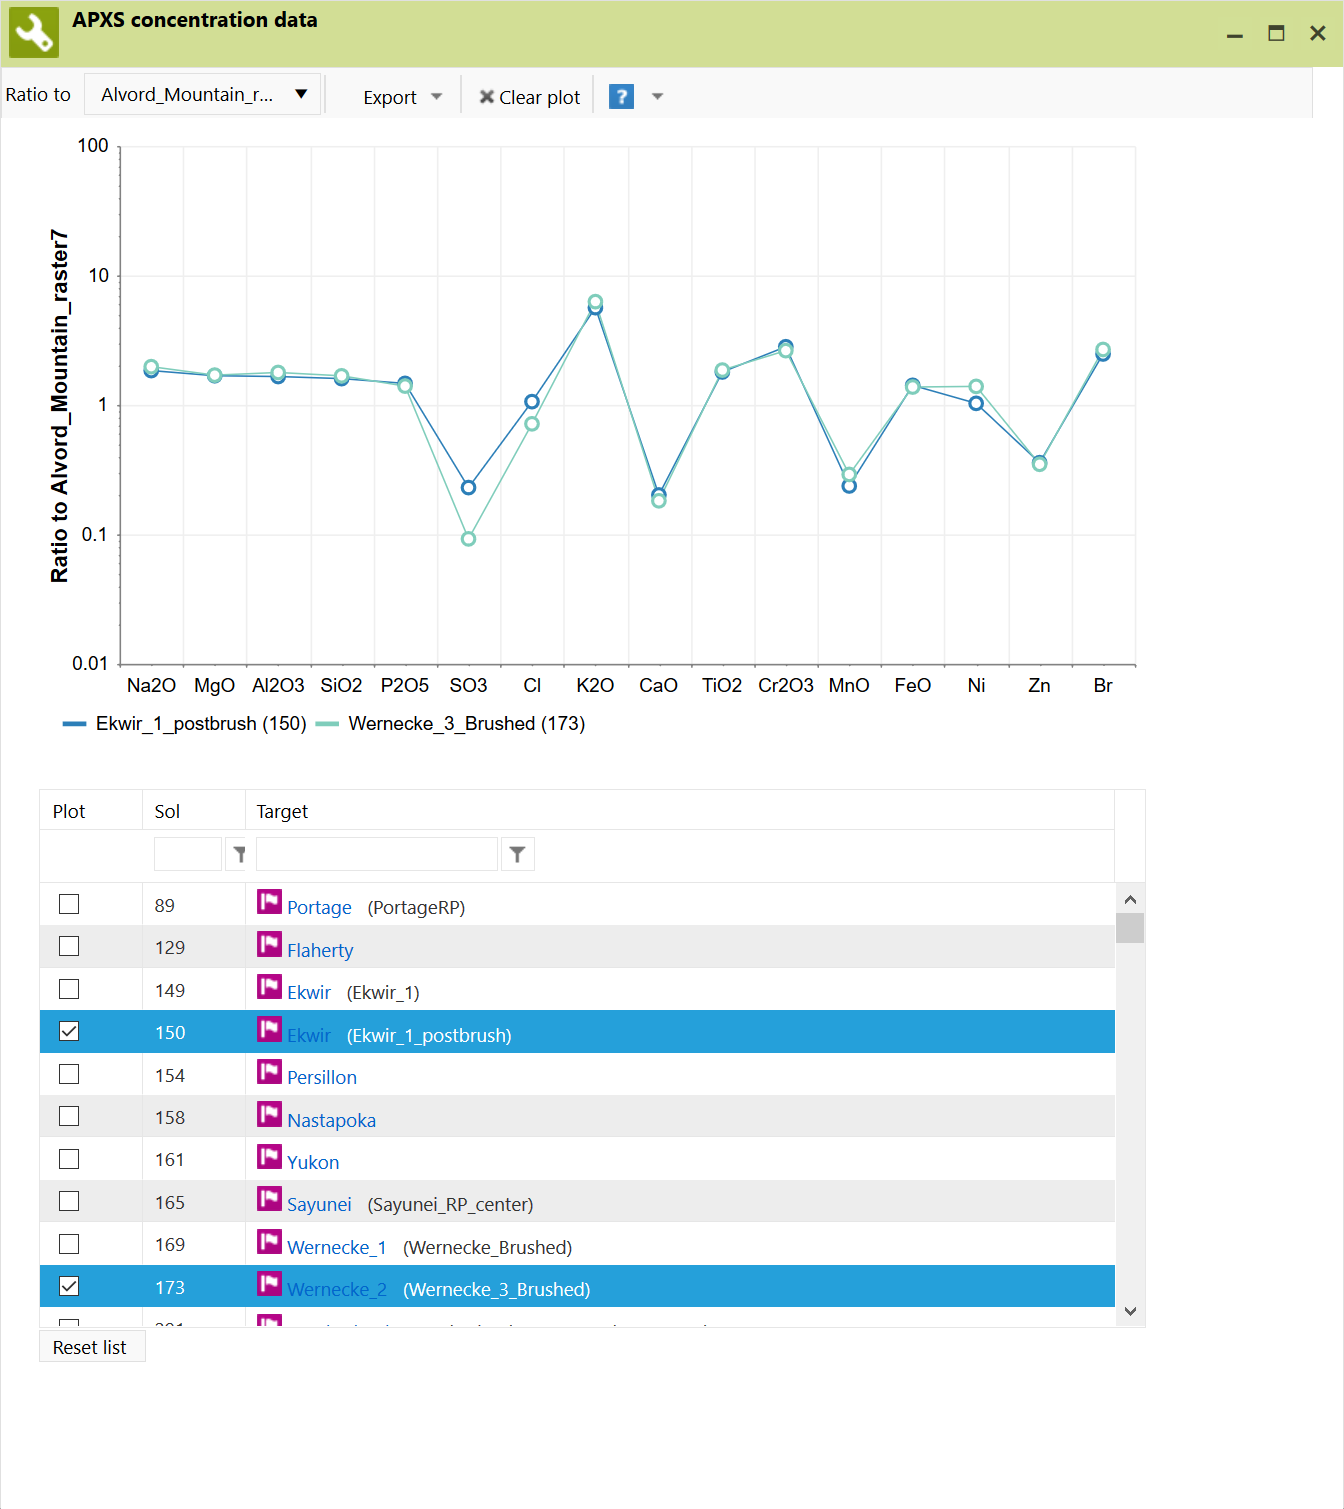
Select one or more targets to plot using the check boxes in the target list. Check the box to include data from a target in the chart and uncheck the box to remove data from the chart. Click on a target name in the list to open its  target detail page. Data from up to six targets may be plotted at the same time. Click on the target list column headers to sort by a particular column. You also may enter a value in the boxes below the column headers to search for particular values. Use the Reset list button at the bottom left to reset the target list.
Finding concentration data for a specific target
Use the 
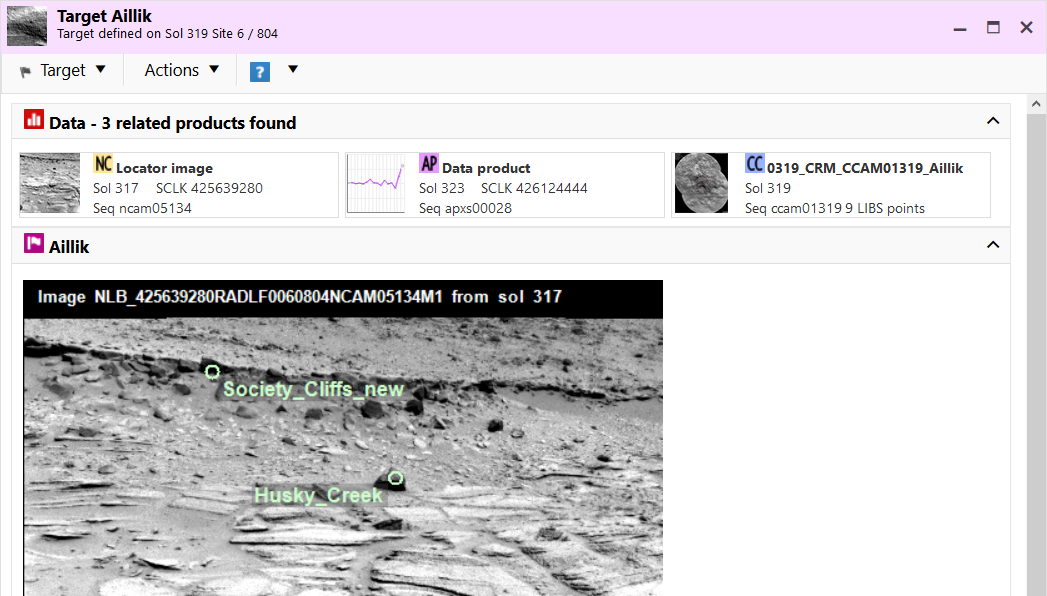
 target search to find APXS concentration data associated with the desired target. The search can be refined by specifying a specific sol range or entering a target name. Upon selecting a target from the results list, details about the target and a link to the concentration data will appear. Click on the source data product to see a plot of the data.
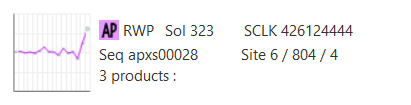
When viewing data in the  Sol browser, APXS products with available concentration data will have a small version of the data plot as it's thumbnail.
Viewing and exporting the data
Whether viewing all APXS concentration data or only data for a specific target, the chart is a chemical ratio plot of the selected target compared to typical Mars soil (represented by the target Sourdough_RP by default). Data can be plotted as a ratio of any other APXS target data using the drop down menu in the chart toolbar.
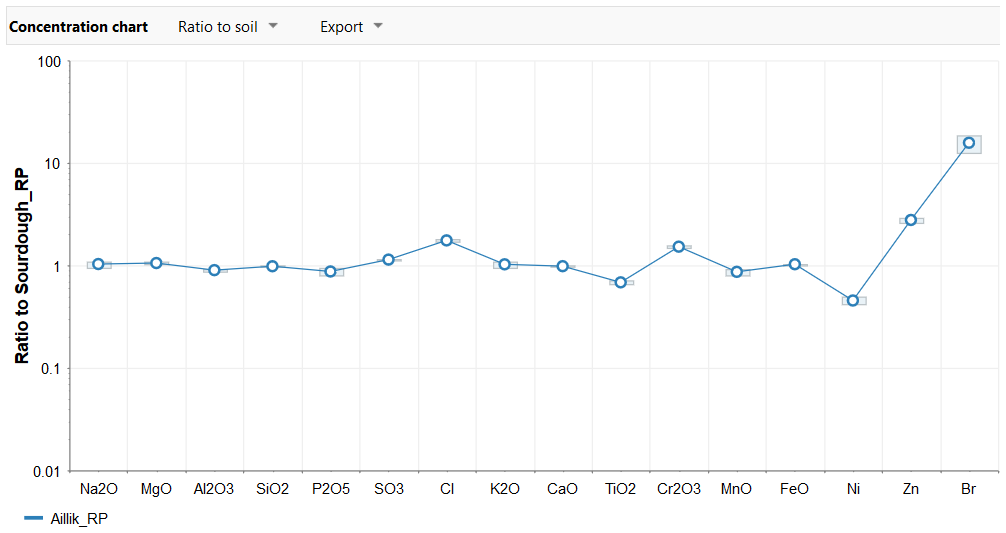
Both the chart and the concentration data can be exported using the chart menu. The chart can be saved as a PNG or PDF file. You can download the data as a CSV file for the current plot or you can get the set of all APXS concentration data within the Notebook. Note the details in the Data quality section of this topic and cite use of the data appropriately.
Concentration data file format
The APXS concentration files contain data as a series of comma separated values, with one row for each reading. The data columns are described in the table below.
| Column | Description | ||
|---|---|---|---|
| sol | Sol of integration | ||
| target | Target name | ||
| fit_type | Spectral analysis software and version | ||
| start_time | LMST integration start time | ||
| gnorm | Geometric normalization factor as an indicator for sample proximity. Value of 100 implies deployed to contact. Conversion of gnorm to standoff given by Figure 1 in VanBommel et al. 2017 XRS (doi:10.1002/xrs.2755). gnorm values reported do not take into account decay of APXS Cm sources and should be corrected for proper standoff estimation especially later in the mission. | ||
| sh_tavg | Integration average temperature of the APXS sensor head in degrees Celsius | ||
| lifetime | Duration of measurement (hh:mm:ss) | ||
| Fe_FWHM | Spectrum resolution defined by the full-width at half-maximum of the Fe Kα peak (6.4 keV) | ||
| Na2O, Na2O_err | Concentrations reported in oxide wt% with associated error (precision). Accuracy for each element provided by Gellert and Clark (2015) Elements (doi:10.2113/gselements.11.1.39). | ||
| MgO, MgO_err | |||
| Al2O3, Al2O3_err | |||
| SiO2, SiO2_err | |||
| P2O5, P2O5_err | |||
| SO3, SO3_err | |||
| Cl, Cl_err | |||
| K2O, K2O_err | |||
| CaO, CaO_err | |||
| TiO2, TiO2_err | |||
| Cr2O3, Cr2O3_err | |||
| MnO, MnO_err | |||
| FeO, FeO_err | |||
| Ni, Ni_err | Concentrations in reported in µg/g (ppm) with associated error (precision). Accuracy for each element provided by Gellert and Clark (2015) Elements (doi:10.2113/gselements.11.1.39). | ||
| Zn, Zn_err | |||
| Br, Br_err | |||
| source_edrs | IDs of archive data products used as sources | ||